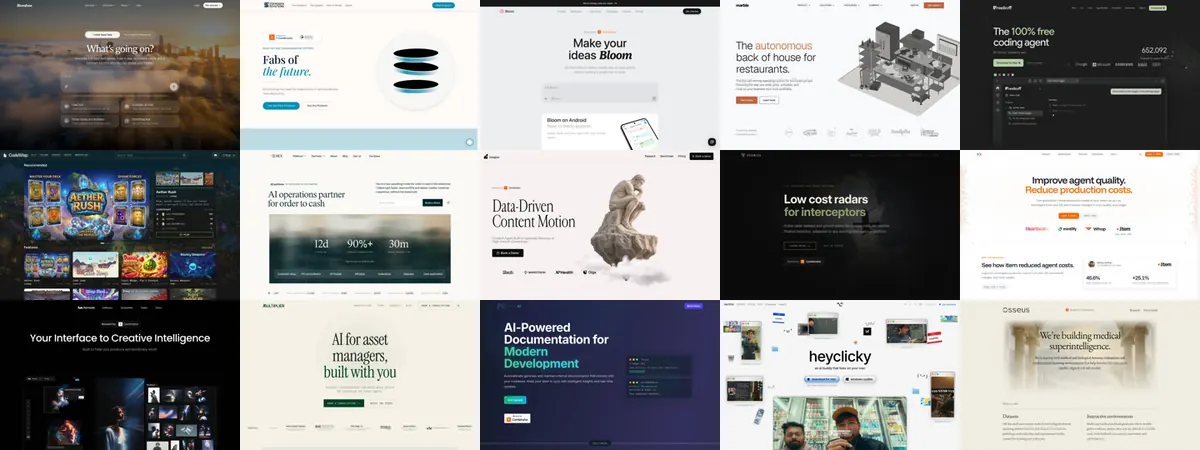
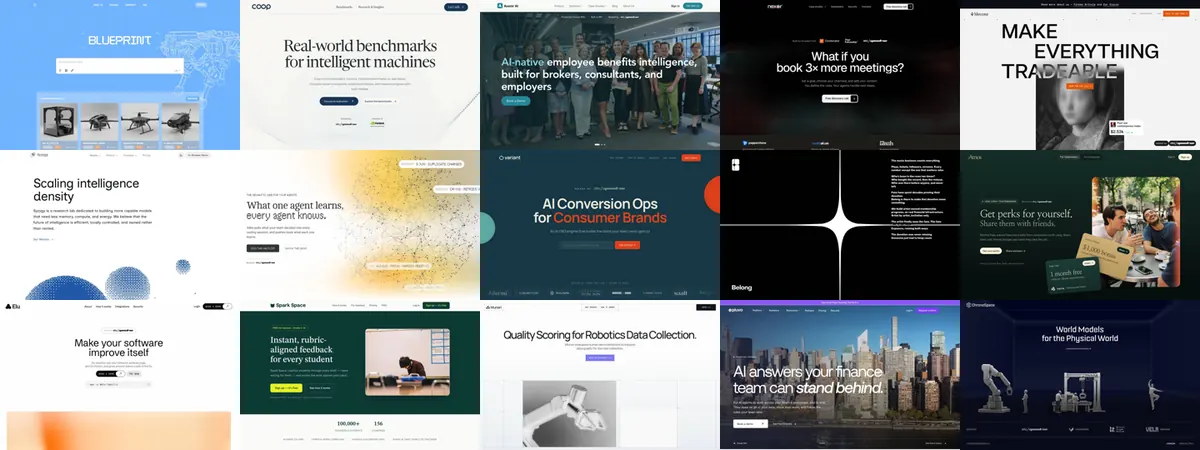
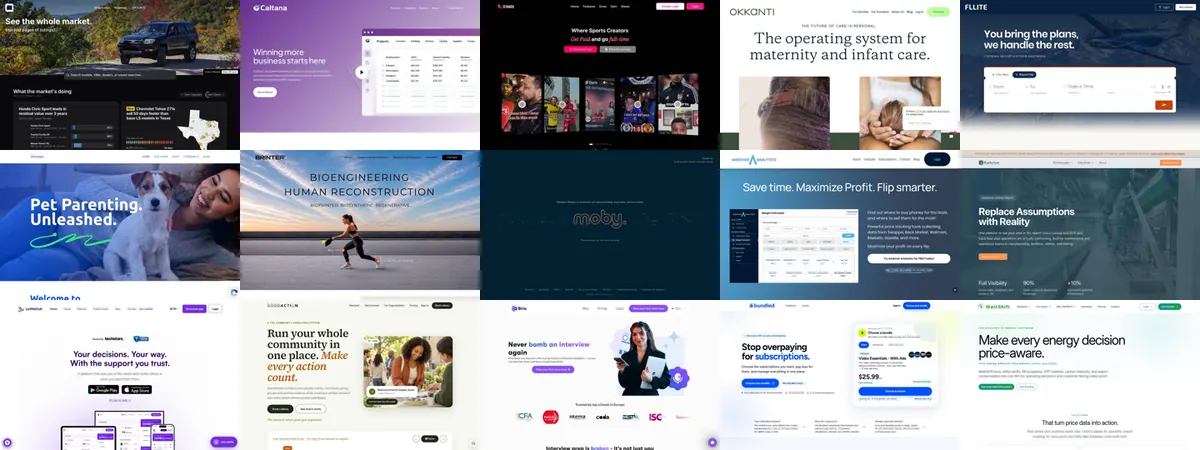
Is there a YC look?Yes, and a16z has it too.
We put 2,832 homepages of Y Combinator companies beside 3,891 from 13 other programs, including a16z, all from the 2022 to 2026 batches and captured the same way. YC homepages are hardest to tell from a16z's, and easier to tell from every other program's. The biggest differences are in what the sites are built with and what they say, more than in how they look.
- 39% of YC homepages mention Y Combinator, the plainest YC mark of all
- 0.64 YC vs a16z by screenshot, where 0.5 means a model can't tell them apart
- 42% vs 27% built with Next.js, YC vs other programs with a similar industry mix
- 4% vs 17% on WordPress, Wix or Squarespace, on the same comparison
1. The plainest YC mark is the badge
39% of YC homepages say "Backed by Y Combinator" or show the orange badge, against under 1% of the others. We trained a simple model on screenshots to tell YC homepages from other programs' with a similar industry mix and batch years. With every YC site in, it scores 0.72, where 0.5 is a coin toss and 1 is never wrong; with the badge sites left out, 0.66. So the badge helps, and there is still a modest difference without it.
2. YC's nearest neighbour is a16z
Comparing every pair of the larger programs on equal footing (240 sites each, YC's badge sites left out) shows where that difference lies. YC is closest to a16z (0.64), and a16z in turn is close to a16z speedrun (0.65). Every other program is easier to tell from YC, from a16z speedrun at 0.71 and Plug and Play at 0.72 to MassChallenge at 0.85. YC is no more distinct than the others are from each other: the closest pair we measured is Plug and Play and MassChallenge (0.61), and some pairs are far apart, such as MassChallenge and 500 Global (0.85).
| YC | a16z | a16z speedrun | Techstars | Plug and Play | MassChallenge | 500 Global | |
|---|---|---|---|---|---|---|---|
| YC | 0.64 | 0.71 | 0.74 | 0.72 | 0.85 | 0.74 | |
| a16z | 0.64 | 0.65 | 0.75 | 0.74 | 0.82 | 0.79 | |
| a16z speedrun | 0.71 | 0.65 | 0.81 | 0.83 | 0.89 | 0.82 | |
| Techstars | 0.74 | 0.75 | 0.81 | 0.68 | 0.73 | 0.67 | |
| Plug and Play | 0.72 | 0.74 | 0.83 | 0.68 | 0.61 | 0.75 | |
| MassChallenge | 0.85 | 0.82 | 0.89 | 0.73 | 0.61 | 0.85 | |
| 500 Global | 0.74 | 0.79 | 0.82 | 0.67 | 0.75 | 0.85 |
This comparison is not matched on industry, so part of it is what each program funds: Techstars, Plug and Play and MassChallenge back more consumer, health and physical-product companies. The badges of other programs (a16z speedrun shows one too) stay in.
3. Where YC differs: the kit and the words
Weighted to a similar broad industry mix and listed year, the other programs' sites are much less likely than YC's to be built with Next.js, somewhat less likely to use Tailwind, far more likely to use a website builder such as WordPress or Wix, and less likely to say "AI" or "agent" at the top of the page.
| YC | Other programs, similar industry mix | Other programs, as they are | |
|---|---|---|---|
| Next.js | 42% | 27% | 23% |
| Tailwind | 51% | 39% | 35% |
| WordPress, Wix or Squarespace | 4% | 17% | 21% |
| “AI” in the headline or the line under it | 39% | 29% | 25% |
| “Agent”, “agents” or “agentic” | 20% | 12% | 8% |
| Main button asks for a demo | 19% | 17% | 15% |
| Dark page background | 33% | 29% | 27% |
| One of the four styles rising in newer YC batches | 35% | 32% | 32% |
| No structured data | 45% | 46% | 46% |
YC is ahead on Next.js in every batch year: by 5 points in the 2022 batches and by 15 to 19 since.
The numbers
| 2022 | 2023 | 2024 | 2025 | 2026 | |
|---|---|---|---|---|---|
| YC | 28.8% | 37.9% | 41.0% | 48.5% | 48.9% |
| Other programs | 23.5% | 20.8% | 21.7% | 29.5% | 34.0% |
4. Program by program
These charts are not matched on industry. On the stack, a16z speedrun, Founders Inc, a16z, Antler and South Park Commons sit next to YC, with Next.js on 34% to 42% of sites and site builders on 12% or fewer. Techstars, Plug and Play and MassChallenge use site builders far more. On words the picture is mixed: South Park Commons and a16z speedrun come closest to YC on "agent", and Plug and Play is not far behind them.
The numbers
| Program | Sites | Share |
|---|---|---|
| Founders Inc | 97 | 42.3% |
| YC | 2,832 | 41.9% |
| a16z speedrun | 275 | 40.0% |
| a16z | 323 | 37.8% |
| Antler | 120 | 37.5% |
| South Park Commons | 102 | 34.3% |
| Entrepreneurs Roundtable Accelerator | 112 | 29.5% |
| 500 Global | 412 | 26.5% |
| Techstars | 1,373 | 18.2% |
| Plug and Play | 715 | 14.3% |
| MassChallenge | 242 | 8.3% |
The numbers
| Program | Sites | Share |
|---|---|---|
| MassChallenge | 242 | 43.8% |
| Plug and Play | 715 | 31.3% |
| Techstars | 1,373 | 24.3% |
| 500 Global | 412 | 16.5% |
| Antler | 120 | 11.7% |
| Entrepreneurs Roundtable Accelerator | 112 | 9.8% |
| a16z | 323 | 9.0% |
| a16z speedrun | 275 | 4.0% |
| South Park Commons | 102 | 3.9% |
| YC | 2,832 | 3.7% |
| Founders Inc | 97 | 3.1% |
The numbers
| Program | Sites | Share |
|---|---|---|
| YC | 2,832 | 19.9% |
| South Park Commons | 102 | 17.6% |
| a16z speedrun | 275 | 14.2% |
| Plug and Play | 715 | 13.1% |
| Founders Inc | 97 | 12.4% |
| a16z | 323 | 10.8% |
| Entrepreneurs Roundtable Accelerator | 112 | 10.7% |
| Antler | 120 | 9.2% |
| 500 Global | 412 | 4.9% |
| Techstars | 1,373 | 4.1% |
| MassChallenge | 242 | 3.7% |
5. Partly San Francisco
YC's directory lists where each company is; the other programs' lists mostly don't, so this check covers YC alone. Bay Area YC companies lean furthest into the kit and the words. YC companies elsewhere sit between them and the other programs: closer to the Bay Area on site builders, and about halfway on Next.js.
| Sites | Next.js | WordPress, Wix or Squarespace | “Agent” | |
|---|---|---|---|---|
| YC, Bay Area | 1,562 | 46% | 2% | 23% |
| YC, elsewhere in the US | 652 | 38% | 5% | 14% |
| YC, outside the US or remote | 553 | 35% | 7% | 18% |
| Other programs, similar industry mix | 3,891 | 27% | 17% | 12% |
6. The look differs less than the stack
Dark pages are only a little more common at YC (33% against 29% for the weighted others), and so are the dark and minimal styles that grew in newer YC batches (35% against 32%), which we described in our YC study. Missing structured data is as common at YC as at the weighted others (45% and 46%), though it ranges from 37% to 54% by program.
How we did it
- Who. YC: every company from the Winter 2022 to the 2026 batches in the public YC directory mirror (which can lag YC's own directory by a few companies) with a live site. Others: the public portfolios of a16z, a16z speedrun, Techstars, Plug and Play, 500 Global, MassChallenge, Antler, South Park Commons, Founders Inc, ERA, AI Grant, Betaworks and Entrepreneur First, pulled October 21, 2026, from 2022 on; companies that are also in YC were left with YC. Not all of these are accelerators. Programs with fewer than 90 live sites are in the totals but not shown on their own. 4% of Founders Inc sites mention Y Combinator, so a few YC companies may be missing from the mirror.
- Capture. Every site loaded in the same headless Chrome, at 1440 × 900 and on a phone-sized screen, with the same rules, on October 21, 2026. Parked, for-sale and blank pages were removed and two listings of one site count once: 2,832 YC and 3,891 other live sites.
- Weighting. YC gives each company one of eight broad industries; the other programs label industries in their own ways. We trained a text classifier on YC's labels and companies' one-line descriptions (77% accurate on YC, against 59% for always guessing the largest industry) and used it to label the others, then weighted the others so their mix of industries and listed years matches YC's. This is rough: "B2B" alone covers most of YC, the labels are predictions, and nothing is matched on location or on which companies are still running. Techstars, Plug and Play and 500 Global still make up most of the weighted group.
- Years differ by program. YC's year is the batch. Most others publish a cohort year; a16z gives the year of first investment; South Park Commons, Founders Inc and Entrepreneur First give a founding year. Plug and Play's lists cover 2024 on.
- Telling them apart. Each first screen was turned into an OpenCLIP (ViT-B-32) image embedding; a logistic regression was trained to separate two groups of equal size, scored by 5-fold cross-validated AUC. The program-by-program table uses 240 sites per program and the average of three random draws. YC sites that mention Y Combinator were left out; other programs' own badges could not be detected and stay in.
- Data. Every figure on this page is in data.json.