YC homepages, 2022–2026.Not copies. A different look.
We captured the homepage of every Y Combinator company from the Winter 2022 to the 2026 batches, 2,838 live sites in all, and measured how alike they are. The short answer: they are not copying each other. What they share is the kit they build from and the words they use, and newer batches' sites look different from older ones.
- 2 pairs of 2,838 sites share what is effectively the same first screen
- 24% → 44% of 2022 vs 2026 batch sites in four styles: research lab, dev tool, hard tech, editorial
- 23% vs 2% of 2022 and 2026 batch sites built on Webflow; Next.js 29% vs 49%
- 39% say "AI" in the headline or the line under it
1. They are not copying each other
We fingerprinted every first screen twice: once for layout and light and dark areas, once with an image model that reads overall style. Then, for each site, we found its closest match among the others from the same batch year.
Copies are almost absent: across all 2,838 sites, only 2 pairs share what is effectively the same first screen. Close look-alikes, with a similar layout and similar colours, are 0.8–2.7% of sites in each batch year, with no trend. Overall style is no tighter in newer batches either: the typical closest-match style similarity is 0.603 for 2022 and 0.607 for 2026, against 0.41 for two sites picked at random.
The one measure that did tighten is colour. Newer batches' palettes sit closer together (a typical colour distance to the closest site of 11.2 for 2022 against 8.2 for 2026), in step with more dark pages: 25% of 2022 batch sites have a dark background, 40% of 2026.
2. Newer batches look different
The spread is the same, but what sits in it is not. We asked an image model to sort the screenshots into twelve style groups and named each by looking at it. The biggest declines are two light styles, the app mockup and the plain SaaS page. Six groups gained three points or more; four of those six, shown here, go from 24% of 2022 batch sites to 44% of 2026.
The numbers
| 2022 | 2023 | 2024 | 2025 | 2026 | |
|---|---|---|---|---|---|
| Light app mockup | 21.3% | 12.3% | 7.2% | 7.4% | 5.3% |
| Light SaaS | 16.1% | 23.0% | 18.7% | 15.2% | 10.9% |
| Research lab | 3.2% | 5.7% | 6.4% | 9.4% | 11.8% |
| Dark dev tool | 7.9% | 6.2% | 9.3% | 11.6% | 11.7% |
| Dark hard tech | 5.0% | 3.8% | 6.0% | 7.9% | 10.4% |
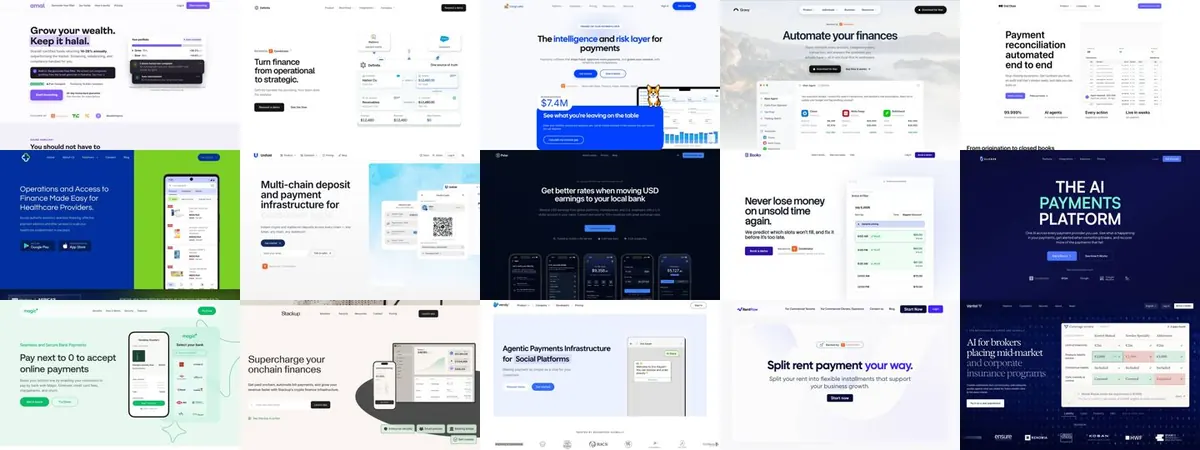
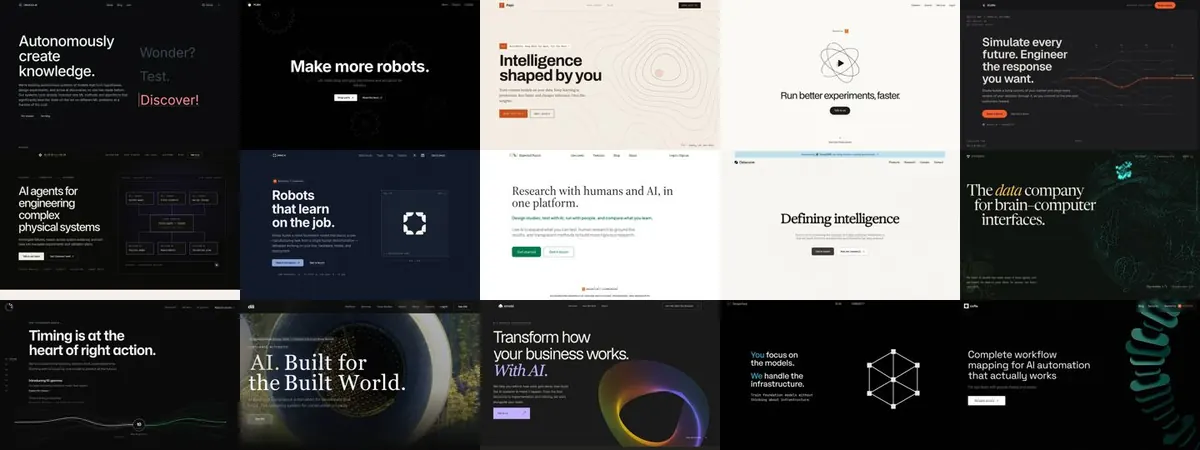
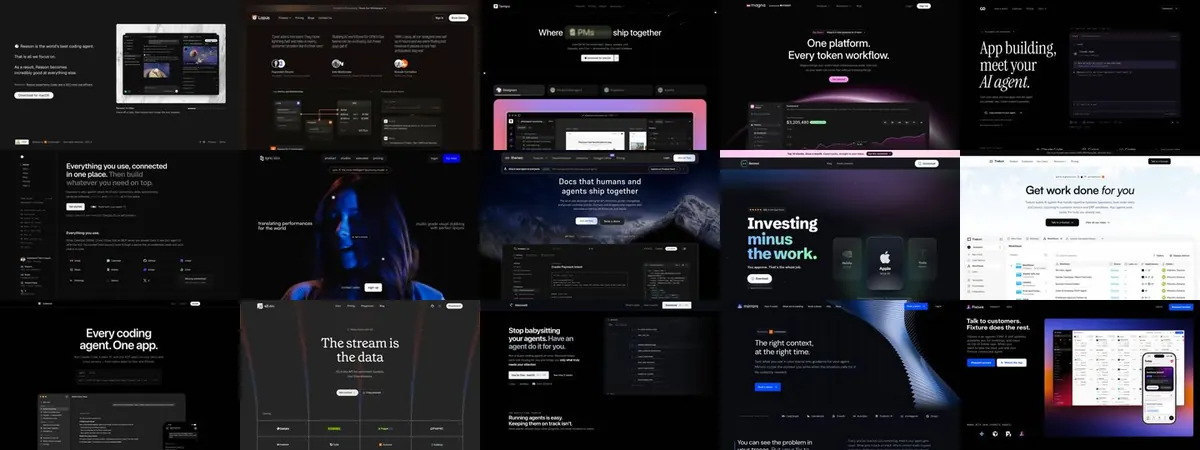
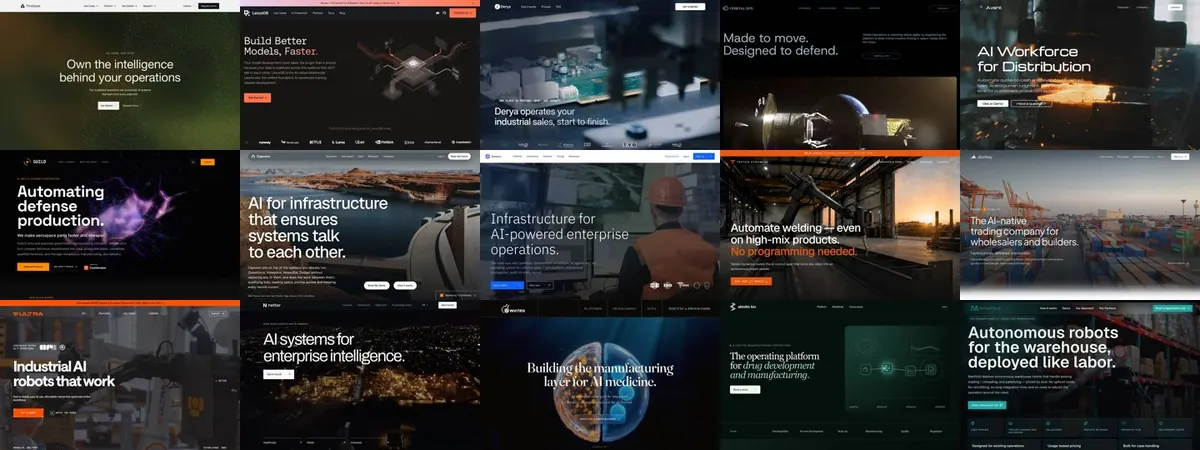
Two things could explain this without any change in taste, and we checked both. First, who YC funds: newer batches have fewer fintech and more industrial companies. But the shift shows up inside B2B, fintech, healthcare and industrial companies separately, and with the 2022 mix of industries held fixed the four styles still go from 24% to 38%. Second, age: a company from the newest batch may only have a launch page. But among full-length pages (at least as much text as the typical 2022 batch page) the four styles still go from 21% to 42%.
What this cannot show is a change over time. Every screenshot is of a site as it is today, so these are companies of different ages side by side, not the same sites followed through the years.
3. The kit is shared
Underneath, many sites share the same parts. Next.js is on 29% of 2022 batch sites and 49% of 2026; Webflow is on 23% and 2%. Framer is most common in the 2024 batches (14%). Half of all sites use Tailwind (51%), 42% are served from Vercel, and the Lucide icon set appears on 30%.
The numbers
| 2022 | 2023 | 2024 | 2025 | 2026 | |
|---|---|---|---|---|---|
| Next.js | 28.8% | 37.9% | 41.0% | 48.5% | 48.9% |
| Tailwind | 40.2% | 47.9% | 52.0% | 58.5% | 52.4% |
| Webflow | 23.0% | 19.4% | 14.9% | 4.8% | 1.7% |
| Framer | 8.2% | 11.8% | 14.4% | 12.1% | 4.9% |
4. So are the words
"AI" is in the headline or the line under it on 39% of sites, most of all in the 2025 batches (45%). "Agent", "agents" or "agentic" is on 12% of 2022 batch sites and about 22% of every batch since 2024. The most common main button is "Book a demo" (10% of sites); 19% of sites, or 25% of those with a main button, ask for a demo in some wording. 39% mention Y Combinator or show a YC badge.
The numbers
| 2022 | 2023 | 2024 | 2025 | 2026 | |
|---|---|---|---|---|---|
| “AI” | 30.1% | 39.3% | 40.3% | 45.1% | 38.1% |
| “agent(s)” | 12.1% | 19.4% | 22.5% | 22.4% | 21.9% |
5. What is not shared
Type. Inter is the most common headline font, but with all its variants it is on only 13% of sites, about the same in every batch year, and the 2,838 sites use 796 different headline font families between them. Founders who want to look different still have type to do it with.
6. Many are hard for search and AI to read
45% have no structured data, 29% no canonical link, 23% no sitemap we could find, and 22% no share image. On 8%, the raw HTML holds under a tenth of the text a visitor sees (blocked fetches not counted), so a crawler that does not run JavaScript reads a near-empty page. Very few block AI crawlers: 2% block GPTBot in robots.txt.
7. Older batches lose their sites
9% and 10% of homepages from the 2022 and 2023 batches are now unreachable, parked or for sale, against 1% for 2025 and under 1% for 2026. Sites that load but show an error page are not counted, so the true share is higher.
How we did it
- Who. Every company from Winter 2022 to the 2026 batches in the public YC directory mirror (yc-oss), downloaded October 20, 2026: 3,121 companies. Each site was loaded in headless Chrome on October 21, 2026 (unreachable sites were tried up to three times), at 1440 × 900 and on a phone-sized screen.
- Cleaning. Pages that loaded but were parking or for-sale pages, or blank, were reclassified by hand-checked rules; two listings pointing at one site count once. That leaves 2,838 live sites, including 6 listed for a 2027 batch, which are left out of the by-year figures.
- Batch year is not design year. Every screenshot is the site as it is today. The trends compare companies from different batches, not the same sites over time; older companies may have redesigned since they launched.
- Sameness. Layout: a 256-bit perceptual hash of the first screen plus a 16 × 10 grid of colours. Style: OpenCLIP ViT-B-32 image embeddings. For each batch year we drew 400 sites 200 times and measured each site's closest match within the draw, so years of different sizes compare fairly. Style groups are k-means clusters; we chose twelve groups in advance and named them by looking at them.
- Stack and words. Builder from the page's own markers (a Webflow page needs Webflow's generator tag or CDN, not just a class name). Words are whole-word matches in the main headline and the line under it.
- Limits. One load per site, from one place, at one time. Image models see style roughly; a human panel might group some sites differently. The directory mirror can lag YC's own by a few companies. We also tried to count page sections (logo strips, feature grids, testimonials) automatically; checked by eye against 40 pages it was not accurate enough, so this page gives no section counts.
- Data. Every figure on this page is in data.json.